Understand the app dashboard, device icons, navigation, and data update speed.
After signing in, the app opens an overview of the energy devices connected to the SmartgridOne Controller. Select a device icon to open the corresponding detail page.
The home or installation value is calculated from the grid connection, solar production, and battery power:
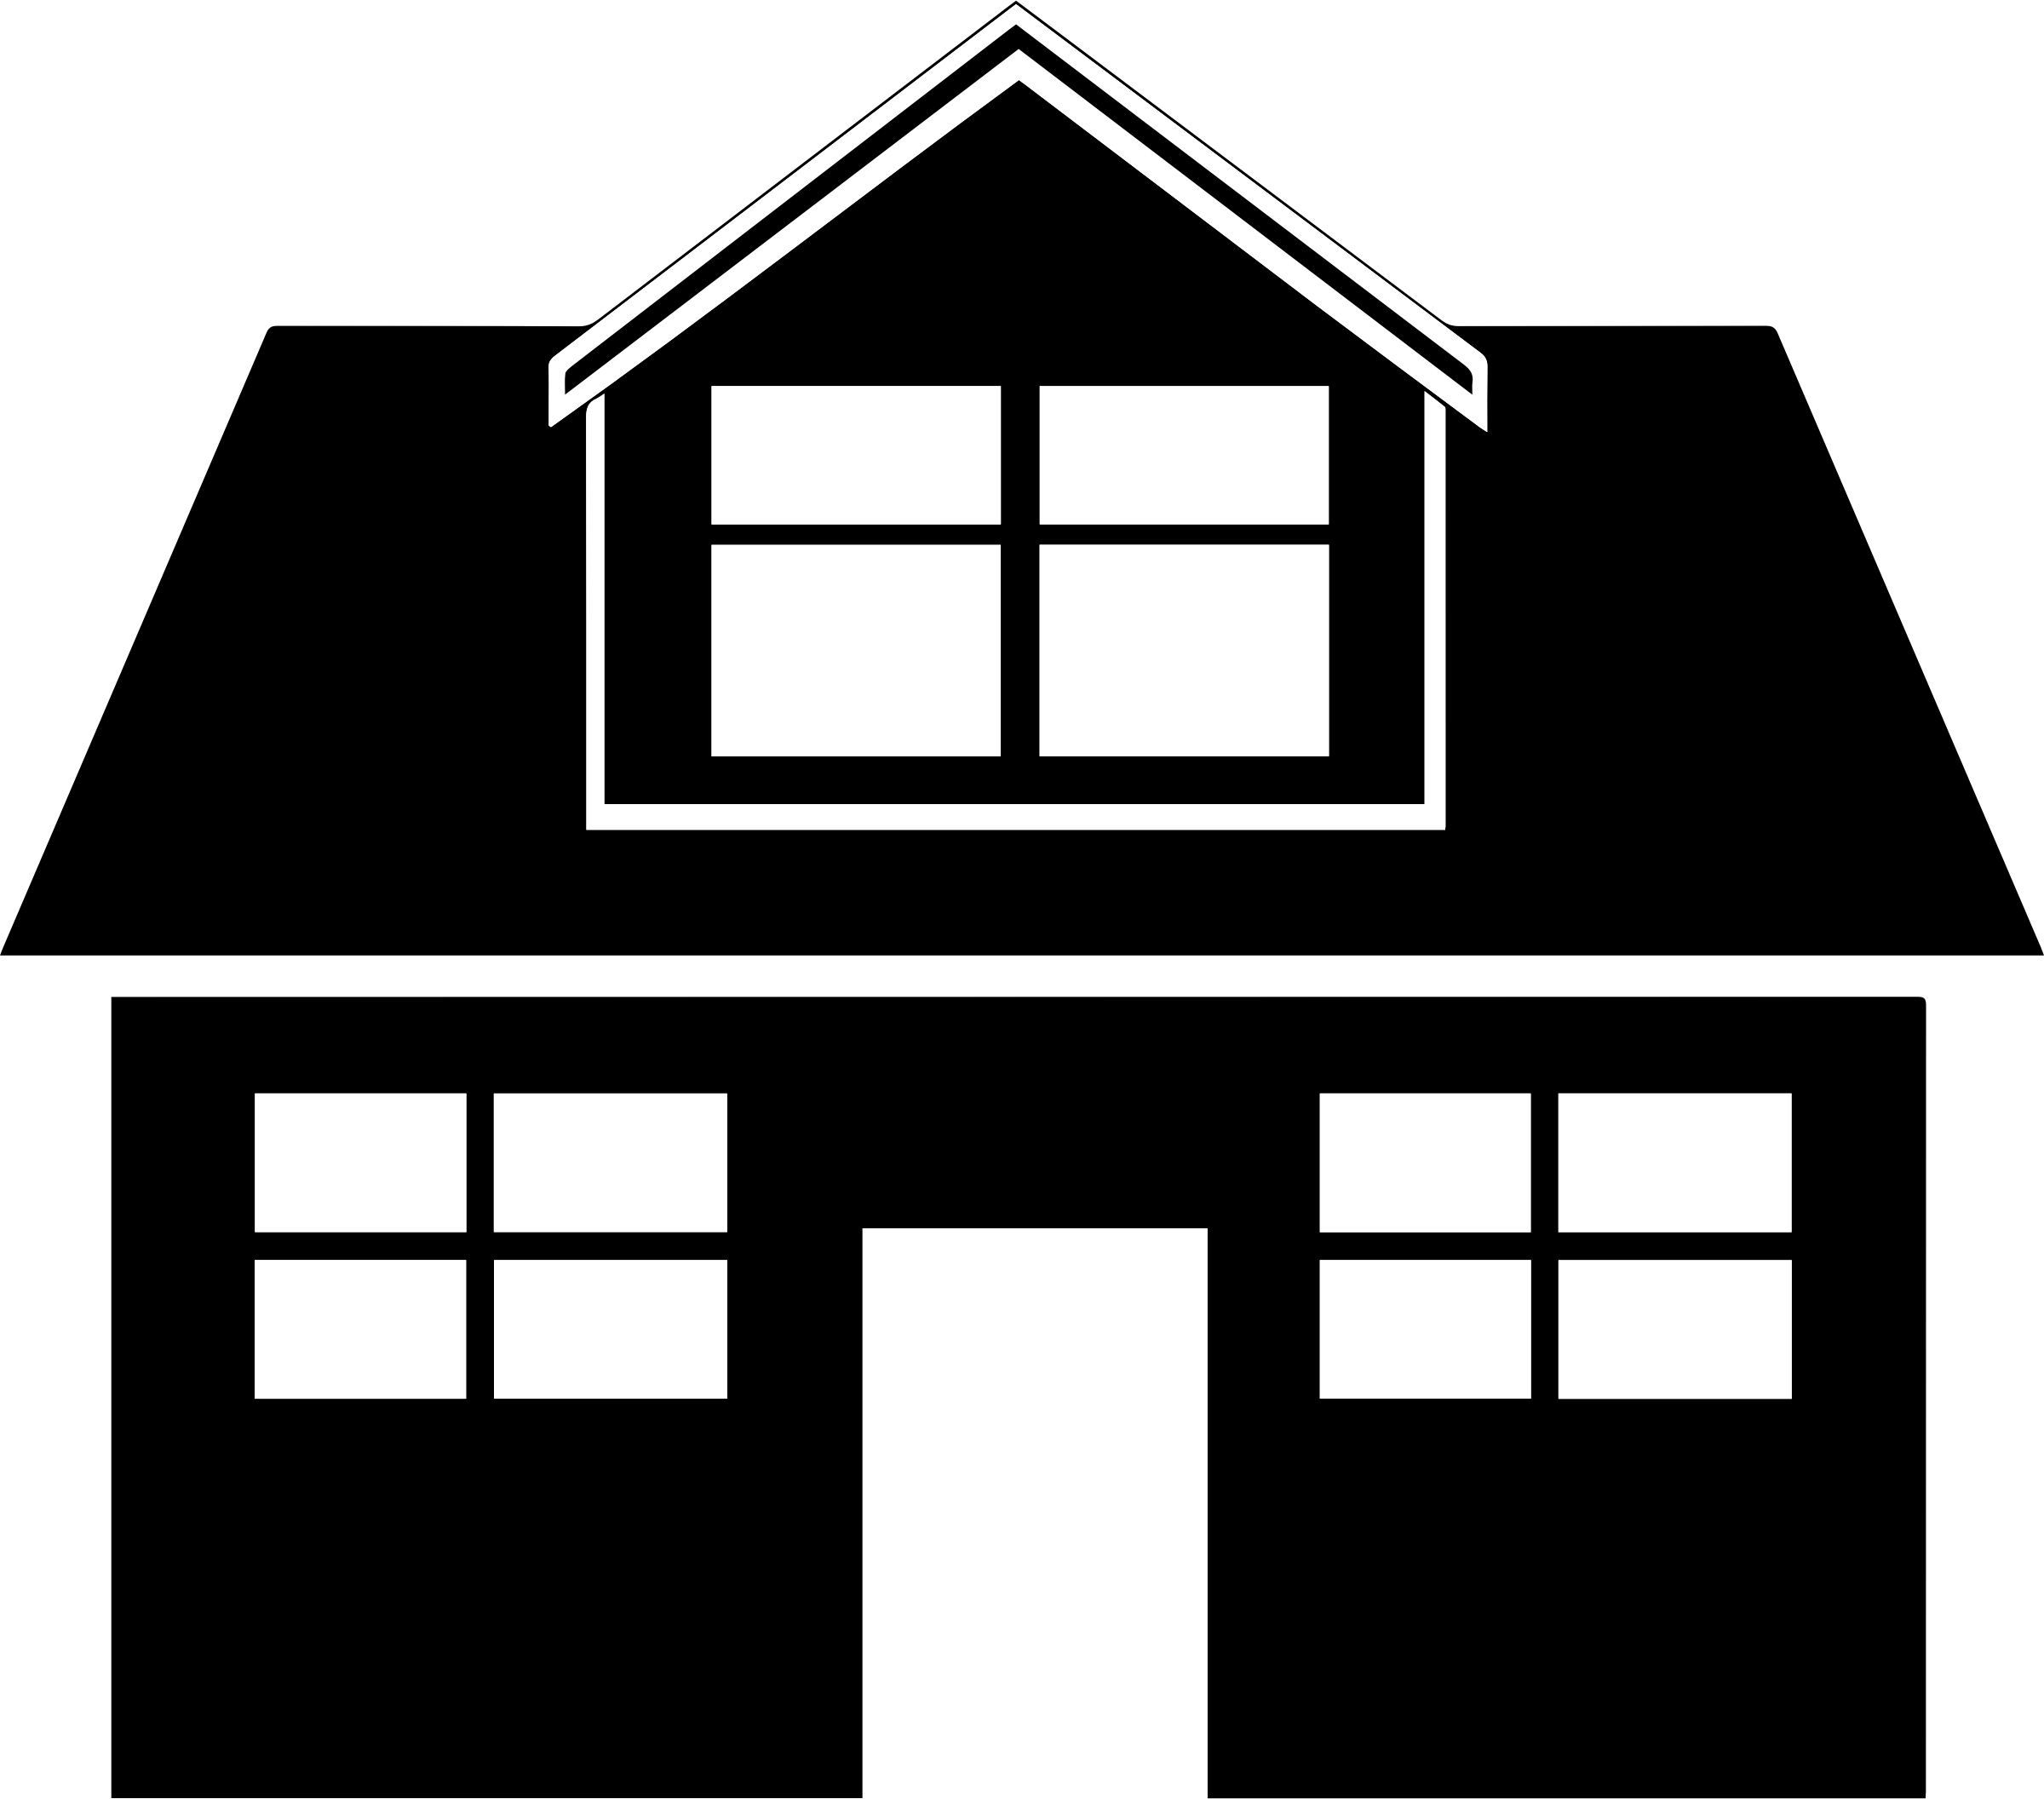 =
=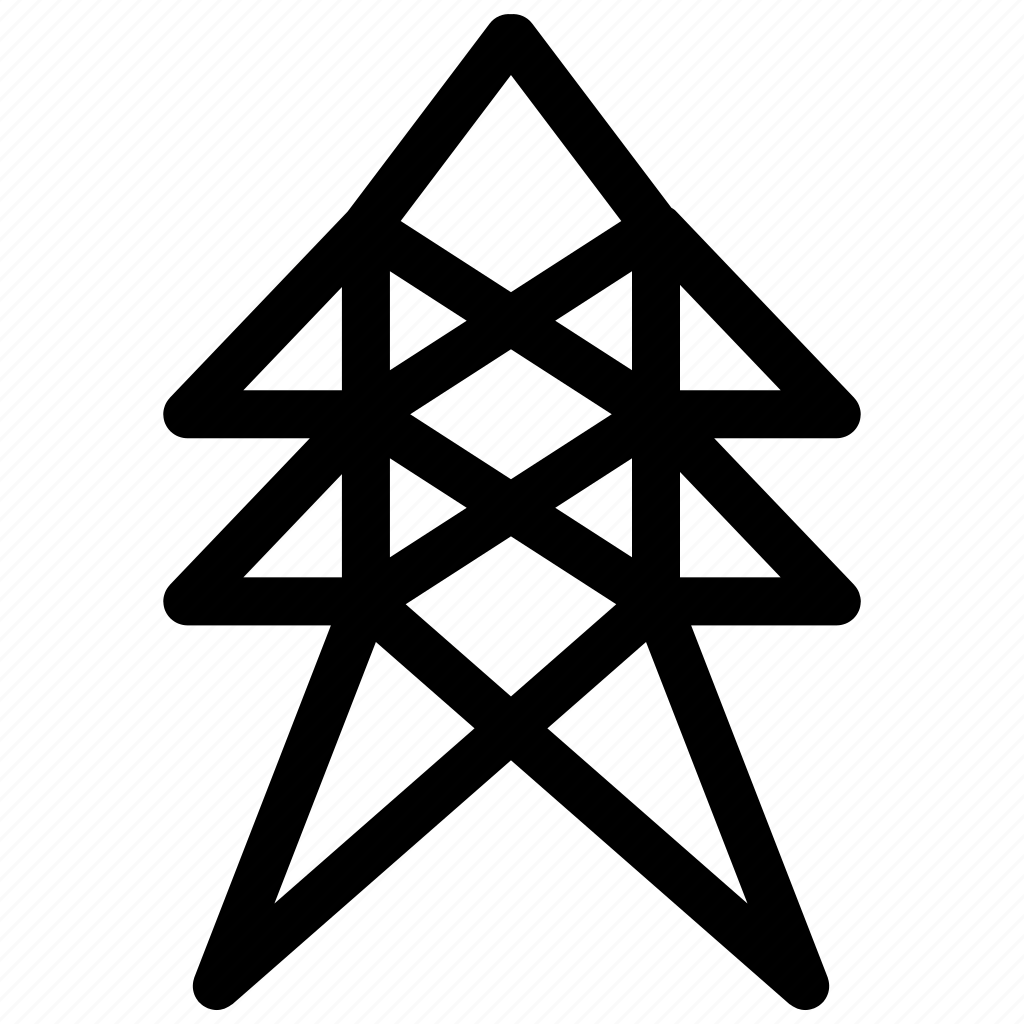 - (
- (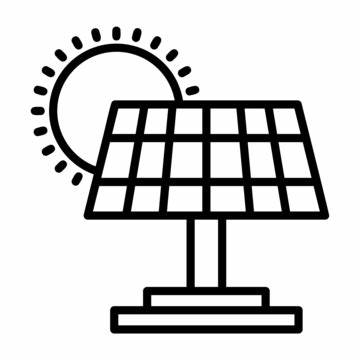 +
+ )
)Production is shown as a negative value because it reduces the power drawn from the grid.
Depending on the installation, the overview can contain:
Icons shown in grey represent device categories that are not connected, monitored, or controlled for the selected installation.
Select an icon on the overview or use the dropdown menu at the top of the app. The dropdown lists all available device categories and is useful when several devices of the same type are connected.
The overview shows real-time data at the fastest rate provided by the SmartgridOne Controller. Device detail graphs use quarter-hour values.
The displayed last update can therefore be newer than the latest point in a quarter-hour graph. The real-time measurement is added to the historical graph after its aggregation interval has completed.